免职声明:本网站为公益性网站,部分信息来自网络,如果涉及贵网站的知识产权,请及时反馈,我们承诺第一时间删除!
This website is a public welfare website, part of the information from the Internet, if it involves the intellectual property rights of your website, please timely feedback, we promise to delete the first time.
电话Tel: 19550540085: QQ号: 929496072 or 邮箱Email: Lng@vip.qq.com
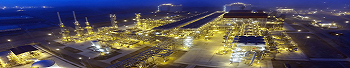
摘要:This graph represents the process of taking liquefied natural gas (LNG) off of the ship, moving it into cold storage tanks and then regasifying it back into natural gas to send to market. The gray lines represent natural gas, and the yellow lines ..
|
This graph represents the process of taking liquefied natural gas (LNG) off of the ship, moving it into cold storage tanks and then regasifying it back into natural gas to send to market. The gray lines represent natural gas, and the yellow lines represent LNG. Naturally, there is a small amount of LNG which vaporizes through contact with warmer air in the top of the ship containers and in the LNG storage tanks. This natural gas is siphoned out of the tanks and moved into the pipeline.
|